Market Structure
Understanding the Trends
Now that we understand how to read candlestick, let us move on to the structure of the market. The foreign exchange market has three main points, namely; trends, ranges, and breakout.
trends
A trend can go up and get down. An upward-moving trend is called uptrend. A trend is moving downward is called downtrend.
Uptrend
Uptrend identified as prices experienced a series of high level higher and higher lows. High level is the peak prices achieved by intermittent price. Low Level is the valley where the price drops before move up back. Therefore uptrend formed when there is a series of high-level rises higher and a series of low-level rise higher.
As the following figure shows an example of an uptrend.
 |
| Uptrend |
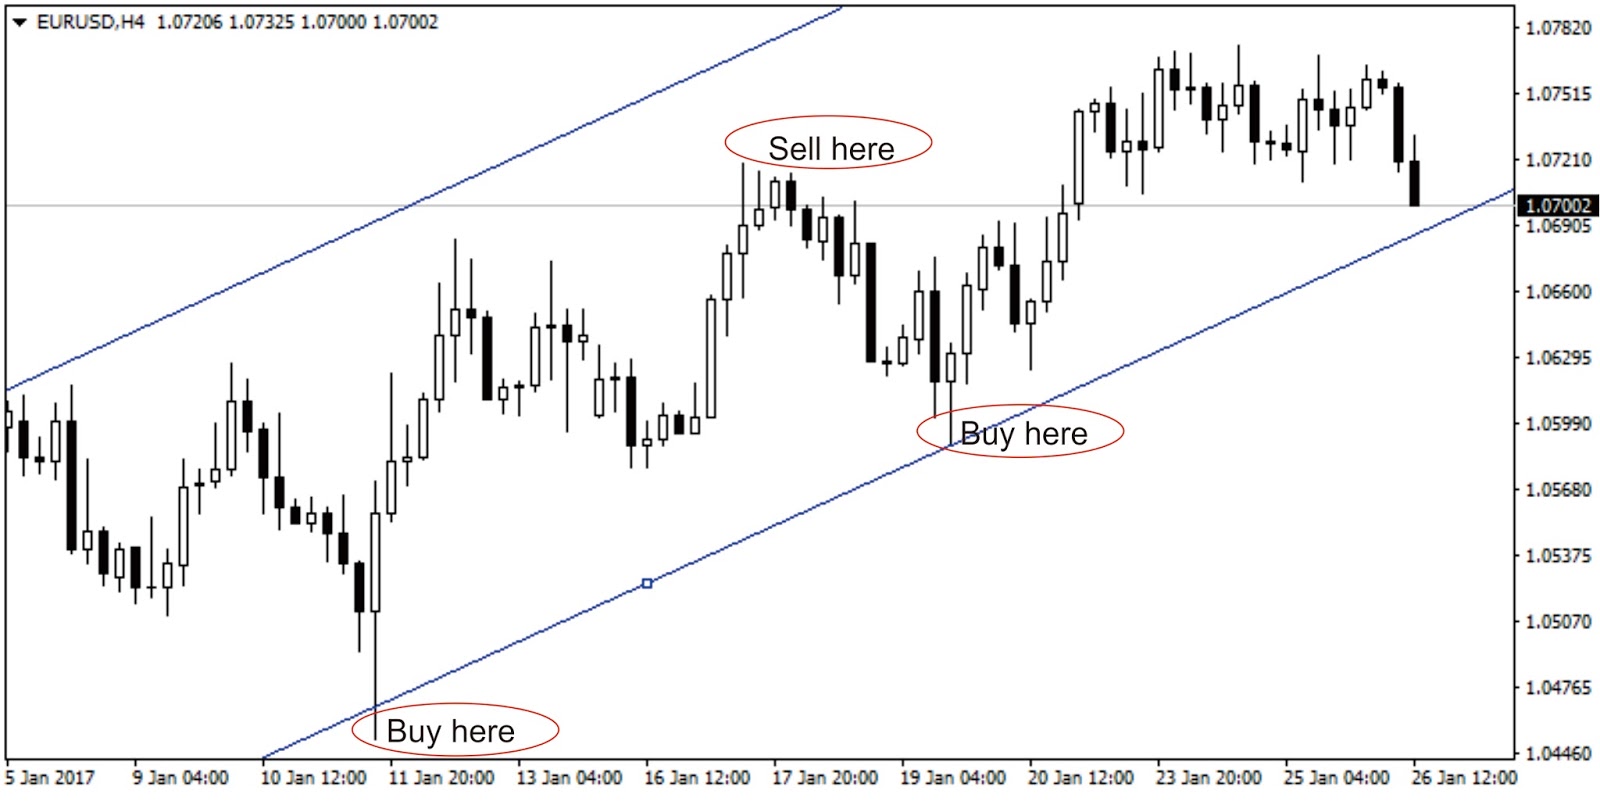
The following figure shows the EUR/USD in a 4-hour time frame (H4) uptrend.
 |
| EUR/USD Uptrend |
The following figure shows the AUD/USD in 1 day time frame (D1) uptrend.
 |
| AUD/USD Uptrend |
Downtrend
Downtrend shows the price moves in a series of high level is lower and lower levels are lower.
As the following figure shows an example of a downtrend.
 |
| Downtrend |
The following figure shows the GBP/USD in a 4-hour time frame (H4) downtrend.
 |
| GBP/USD Downtrend |
The following figure shows the USD/JPY in a 1-hour time frame (H1) downtrend.
 |
| USD/JPY Downtrend |
Trendline
The trend line is a line that is made to indicate the direction prices are taking place. The trend line is a visual representation to give us an understanding of the direction of prices in the future. In an uptrend, we create a trend line by combining a low level is higher. On the downtrend, we create a trend line by combining the high level is lower.
Increasingly steeper angle of the trend line, the stronger the momentum. However, it is important to understand that the trend with steep angles often do not last long.
Traders use trend lines to show three things:
- Directions trend
- Angle trends
- Chart pattern that may flourish.
The following figure shows an example of a uptrend line, AUD/JPY, 1 hour time frame (H1).
 |
| AUD/JPY Uptrend (trend line) |
The following figure shows an example of a downtrend line on GBP/USD, 4 hour time frame (H4).
 |
| GBP/USD Downtrend (trendline) |
Understanding the Trends
In an uptrend, it is easy for us to conclude that the price rose because more buyers than sellers. However, this is not true. In the forex market, the number of contracts purchased is always equal to the amount sold. For example, if you want to buy five lots of EUR / USD, the contract must be provided by a person who wants to sell it. Conversely, if you want to sell the three lots of USD / JPY, there must be someone willing to buy it.
Therefore, the amount of long positions and short positions in the foreign exchange market is always the same. When the number of contracts sold and bought is always the same, why the price moves up and down? The reason is because of the intensity of emotions between buyers and sellers.
In an uptrend, the buyer in control because they do not feel heavy to pay dearly. Nominally to buy at high prices as predicted prices will rise even higher. Sellers feel uneasy when the trend is going up, and they agree to sell only at a higher price. The price goes up because of the intensity of the greed buyers beat sellers fear and anxiety. Uptrend began faltered only when the buyer refuses to buy at a higher price.
In a downtrend, the sellers in control because they do not find it hard to sell at low prices. They sell at a low price because it expects the price will fall further. Buyers them anxious when the trend is down, and they agree to buy only at a low price. Prices go down because of the intensity of greed seller conquered fear and anxiety buyers. Downtrend started faltered only when the seller refuses to sell at lower prices.
Range
A range occurs when prices traded in a channel between the two borders. Using the analogy of a rubber ball bouncing, the price seemed bouncing between the floor and ceiling. Ceiling called the resistance, while the floor is called the support area.
Look at the picture below:
The following figure shows the GBP/USD (1-week time frame, W1) moved in a range.
The following figure shows the EUR/USD (4 hours time frame, H4) moved in a range.
The following figure shows the EUR/USD (4 hours time frame, H4) moved in a range.
In a range, the trader will sell once prices rebound from the resistance level as it tends drove down. Similarly, the trader will buy so the price bounces off the support level as prices tend drove to the top.
As shown at the picture below:

Breakout
A breakout occurs when prices push above resistance or below support area after fluctuating between trade channels over a period of time. Momentum is greatest at the breakout point for the traders tend to take advantage of this special movement by buying so prices shot up from a trading range or sell once the price shot down from a trading range.
Breakout in the resistance area:
The following picture shows a breakout in the GBP/USD (1 hour time frame, H1):
The following picture shows a breakout in the AUD/USD (30 minutes time frame, H1):
And then breakout in the support area:
The following picture shows a breakout in the AUD/USD (4 hours time frame, H4):
Summary
Trader make money in the forex market by entering into a trade long positions and short positions.
Trader took long positions against the currency pair when they expect the base currency to rise against the counter currency. Traders will take short positions against the currency pair when they expect the base currency to fall against the counter currency.
Basically, there are three points in each trade, namely: entry prices, stop losses and profit targets. Entry price is the price at which the transaction was triggered. Stop loss is a level to stop the deal with losses when the direction is in line with expectations. Target profit is a level to get out of the transaction with a profit when the market moves as expected.
For a buy position, the target profit is placed above the entry price and stop loss placed below it. For short positions, profit targets placed below the entry price and stop loss placed thereon.
Brokers charge a fee for each buy or sell transaction conducted on their platform. This is called the spread. In general, lower spreads for currency pairs are the most liquid, such as EUR / USD. For long positions, the trader will make transactions at the price demand, and exit at the offer price. For a short position, the trader would make a transaction on the proposed price and exit at a price request.
Four main factors that cause fluctuating currency prices are: economic factors, political factors, natural disasters, and speculation. Since currencies are quoted in pairs, fractional theory helps merchants understand the general direction of the market.
The main issue is the fractional theory juxtaposing the strongest currency against the weakest currency at any time. If we pair's strongest currency against the weakest currency numerator to the denominator, the result is a strong up trend. In this case it is wise if traders taking long positions. Vice versa, if we reconcile the currency against the weakest to the strongest currency numerator to the denominator, the result is a strong downtrend. In this case it is wise if traders took short positions.
Three ways to read forex charts are: line charts, bar charts, and candlestick. Candlestick is the major ones choice for traders worldwide. Candlestick shows the four most important price points in each period, ie the opening price, highest level, the lowest level, and the closing price. This chart also shows the intensity of the battle between bulls and bears.
The foreign exchange market can be divided into three simple structure, namely: trends, ranges, and breakout. Uptrend occurs when the price moves consistently at a high level higher and higher lows. Downtrend occurs when the price moves consistently at a high level is lower, and the lower level is lower.
A range occurs when prices tend to bounce between two levels of support and resistance. A breakout occurs when prices moved firmly above the strong resistance level or below the support level.
Thus, I have explained in a simple (from part one, two, three or four) how to make money in forex. For more, I will explain in the next post. Remain in my blog.
Range
A range occurs when prices traded in a channel between the two borders. Using the analogy of a rubber ball bouncing, the price seemed bouncing between the floor and ceiling. Ceiling called the resistance, while the floor is called the support area.
Look at the picture below:
 |
| The concept of a range |
 |
| GBP/USD in a range |
The following figure shows the EUR/USD (4 hours time frame, H4) moved in a range.
 |
| EUR/USD in a range |
 |
| EUR/GBP in a range |
As shown at the picture below:
Breakout
A breakout occurs when prices push above resistance or below support area after fluctuating between trade channels over a period of time. Momentum is greatest at the breakout point for the traders tend to take advantage of this special movement by buying so prices shot up from a trading range or sell once the price shot down from a trading range.
Breakout in the resistance area:
 |
| Breakout at resistance area |
 |
| GBP/USD breakout |
The following picture shows a breakout in the AUD/USD (30 minutes time frame, H1):
 |
| AUD/USD breakout |
And then breakout in the support area:
 |
| Breakout at support area |
The following picture shows a breakout in the AUD/USD (4 hours time frame, H4):
 |
| AUD/USD breakout |
Trader make money in the forex market by entering into a trade long positions and short positions.
Trader took long positions against the currency pair when they expect the base currency to rise against the counter currency. Traders will take short positions against the currency pair when they expect the base currency to fall against the counter currency.
Basically, there are three points in each trade, namely: entry prices, stop losses and profit targets. Entry price is the price at which the transaction was triggered. Stop loss is a level to stop the deal with losses when the direction is in line with expectations. Target profit is a level to get out of the transaction with a profit when the market moves as expected.
For a buy position, the target profit is placed above the entry price and stop loss placed below it. For short positions, profit targets placed below the entry price and stop loss placed thereon.
Brokers charge a fee for each buy or sell transaction conducted on their platform. This is called the spread. In general, lower spreads for currency pairs are the most liquid, such as EUR / USD. For long positions, the trader will make transactions at the price demand, and exit at the offer price. For a short position, the trader would make a transaction on the proposed price and exit at a price request.
Four main factors that cause fluctuating currency prices are: economic factors, political factors, natural disasters, and speculation. Since currencies are quoted in pairs, fractional theory helps merchants understand the general direction of the market.
The main issue is the fractional theory juxtaposing the strongest currency against the weakest currency at any time. If we pair's strongest currency against the weakest currency numerator to the denominator, the result is a strong up trend. In this case it is wise if traders taking long positions. Vice versa, if we reconcile the currency against the weakest to the strongest currency numerator to the denominator, the result is a strong downtrend. In this case it is wise if traders took short positions.
Three ways to read forex charts are: line charts, bar charts, and candlestick. Candlestick is the major ones choice for traders worldwide. Candlestick shows the four most important price points in each period, ie the opening price, highest level, the lowest level, and the closing price. This chart also shows the intensity of the battle between bulls and bears.
The foreign exchange market can be divided into three simple structure, namely: trends, ranges, and breakout. Uptrend occurs when the price moves consistently at a high level higher and higher lows. Downtrend occurs when the price moves consistently at a high level is lower, and the lower level is lower.
A range occurs when prices tend to bounce between two levels of support and resistance. A breakout occurs when prices moved firmly above the strong resistance level or below the support level.
Thus, I have explained in a simple (from part one, two, three or four) how to make money in forex. For more, I will explain in the next post. Remain in my blog.
No comments:
Post a Comment